

Monitoring/Observability
This guide will help you to install and configure tools to monitor your PeerTube platform to store and analyze the following components:
- Metrics (PeerTube stats, OS CPU, PostgreSQL queries etc)
- PeerTube Logs
- PeerTube traces (details of CPU time spent in PeerTube functions, more suited for developers)
It will use the following software that can be installed on another server:
- Grafana to visualize data from Prometheus, Tempo and Loki
- Prometheus to store and query OS, PeerTube, PostgreSQL and Redis metrics
- Tempo to store and query PeerTube traces
- Loki to store and query PeerTube logs
- Promtail to send PeerTube logs to Loki
Installing Prometheus, Tempo, Loki and Grafana is out of the scope of this guide.
OS/PeerTube metrics in Prometheus
PeerTube follows OpenTelemetry standard and can export its metrics in Prometheus format. A Prometheus compatible scraper can then fetch these metrics.
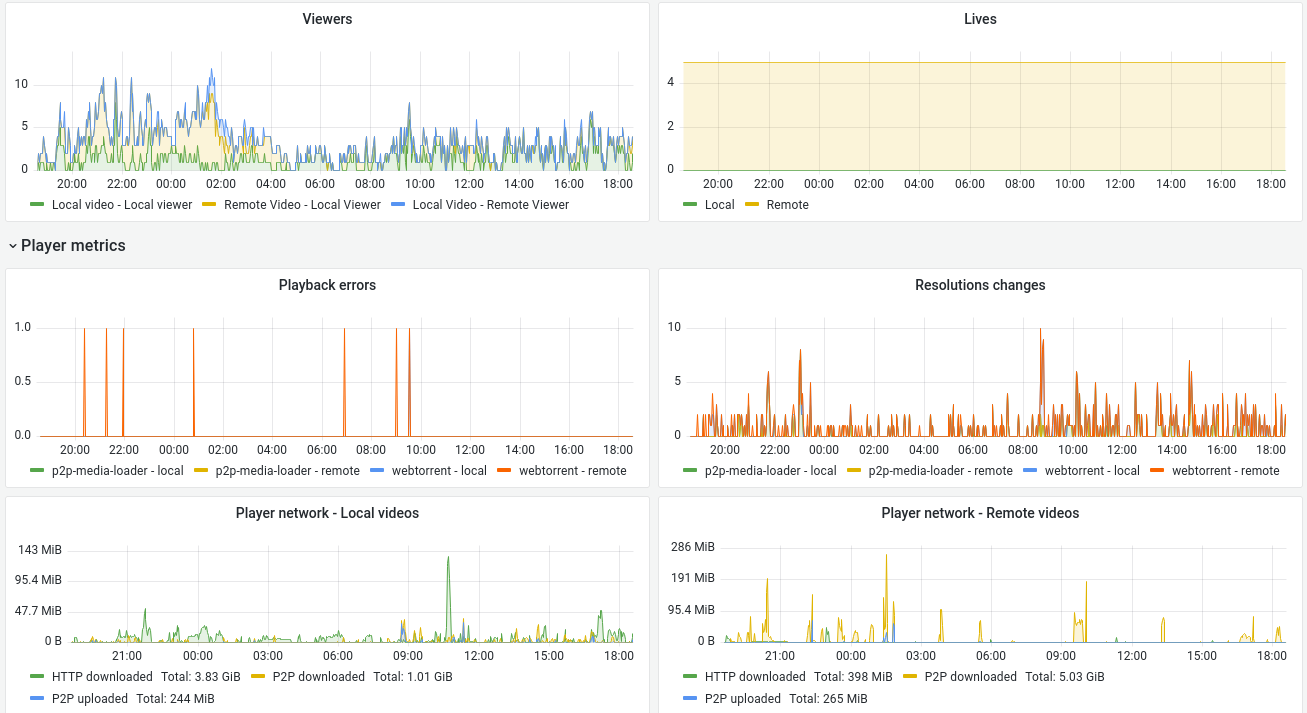
Here is a non exhaustive list of metrics you may find interesting:
- Viewers count on local/remote videos
- Viewer network stats (HTTP download and P2P download/upload)
- Viewer playback errors
- HTTP requests (timing, count etc)
- Job queue information (waiting/active jobs etc)
- ...
Installing other Prometheus exporters like PostgreSQL exporter, Redis exporter and Node (OS metrics) exporter will allow us to create a detailed Grafana dashboard.
You can choose to only install one of these exporters or just use metrics exported by PeerTube if you want.
Enable PeerTube metrics exporter
Update your PeerTube configuration and set open_telemetry.metrics.enabled to true. After a restart, your PeerTube platform will expose its metrics on http://peertube.example.com:9091/metrics.
Install other Prometheus exporters
Install and configure PostgreSQL, Redis and Node exporters on your PeerTube server. For example on Debian Trixie:
apt install prometheus-postgres-exporter prometheus-node-exporter prometheus-redis-exporter apache2-utilsConfigure the exporters:
prometheus-postgres-exporter- Set the following in
/etc/default/prometheus-postgres-exporter
bashDATA_SOURCE_NAME='user=prometheus host=/run/postgresql dbname=postgres' ARGS='--web.listen-address="127.0.0.1:9187"'- Configure PostgreSQL using
sudo -u postgres psql
sql-- To use IF statements, hence to be able to check if the user exists before -- attempting creation, we need to switch to procedural SQL (PL/pgSQL) -- instead of standard SQL. -- More: https://www.postgresql.org/docs/9.3/plpgsql-overview.html -- To preserve compatibility with <9.0, DO blocks are not used; instead, -- a function is created and dropped. CREATE OR REPLACE FUNCTION __tmp_create_user() returns void as $$ BEGIN IF NOT EXISTS ( SELECT -- SELECT list can stay empty for this FROM pg_catalog.pg_user WHERE usename = 'postgres_exporter') THEN CREATE USER postgres_exporter; END IF; END; $$ language plpgsql; SELECT __tmp_create_user(); DROP FUNCTION __tmp_create_user(); ALTER USER postgres_exporter WITH PASSWORD 'password'; ALTER USER postgres_exporter SET SEARCH_PATH TO postgres_exporter,pg_catalog; -- If deploying as non-superuser (for example in AWS RDS), uncomment the GRANT -- line below and replace <MASTER_USER> with your root user. -- GRANT postgres_exporter TO <MASTER_USER>; GRANT CONNECT ON DATABASE postgres TO postgres_exporter; GRANT pg_monitor to postgres_exporter;- Set the following in
prometheus-node-exporter- Set the following in
/etc/default/prometheus-node-exporter
- Set the following in
ARGS='--web.listen-address="127.0.0.1:9100"'prometheus-redis-exporter- Set the following in
/etc/default/prometheus-redis-exporter
- Set the following in
ARGS='--web.listen-address="127.0.0.1:9121"'NGINX configuration
Now we'll configure the reverse proxy to expose these exporter metrics with authentication.
First, we generate the htpasswd file. Run as root:
mkdir /etc/nginx/htaccess
htpasswd -c /etc/nginx/htaccess/peertube_prometheus scraper
Add the following NGINX configuration at the beginning of your /etc/nginx/site-enabled/peertube file:
# PeerTube Prometheus exporter
server {
  listen 9092;
  listen [::]:9092;

  auth_basic           "Auth";
  auth_basic_user_file /etc/nginx/htaccess/peertube_prometheus;

  location / {
    proxy_pass http://localhost:9091;
  }
}

# PostgreSQL Prometheus exporter
server {
  listen 9188;
  listen [::]:9188;

  auth_basic           "Auth";
  auth_basic_user_file /etc/nginx/htaccess/peertube_prometheus;

  location / {
    proxy_pass http://localhost:9187;
  }
}

# Node server Prometheus exporter
server {
  listen 9101;
  listen [::]:9101;

  auth_basic           "Auth";
  auth_basic_user_file /etc/nginx/htaccess/peertube_prometheus;

  location / {
    proxy_pass http://localhost:9100;
  }
}

# Redis Prometheus exporter
server {
  listen 9122;
  listen [::]:9122;

  auth_basic           "Auth";
  auth_basic_user_file /etc/nginx/htaccess/peertube_prometheus;

  location / {
    proxy_pass http://localhost:9121;
  }
}
Test your metrics
Run your exporters and reload nginx as root:
systemctl restart peertube prometheus-postgres-exporter.service prometheus-redis-exporter.service prometheus-node-exporter.service
nginx -t && systemctl reload nginx
You can check metrics are correctly exposed using the following endpoints:
- http://peertube.example.com:9092 for PeerTube metrics
- http://peertube.example.com:9101 for OS metrics
- http://peertube.example.com:9122 for Redis metrics
- http://peertube.example.com:9188 for PostgreSQL metrics
Configure Prometheus
Now your metrics are correctly exported, you can configure your Prometheus server to scrape them. Add the following scrape configuration in your Prometheus configuration (replace peertube.example.com and your-password strings):
scrape_configs:
  - job_name: 'peertube'

    basic_auth:
      username: scraper
      password: your-password

    static_configs:
      - targets: [ 'peertube.example.com:9092' ]
        labels:
          instance: 'peertube.example.com'


  - job_name: 'postgresql'

    basic_auth:
      username: scraper
      password: your-password

    static_configs:
      - targets: [ 'peertube.example.com:9188' ]
        labels:
          instance: 'peertube.example.com'


  - job_name: 'node'

    basic_auth:
      username: scraper
      password: your-password

    static_configs:
      - targets: [ 'peertube.example.com:9101' ]
        labels:
          instance: 'peertube.example.com'


  - job_name: 'redis'

    basic_auth:
      username: scraper
      password: your-password

    static_configs:
      - targets: [ 'peertube.example.com:9122' ]
        labels:
          instance: 'peertube.example.com'
Save and restart prometheus:
systemctl restart prometheusYou metrics can now be queried on your Prometheus instance.
PeerTube logs in Loki
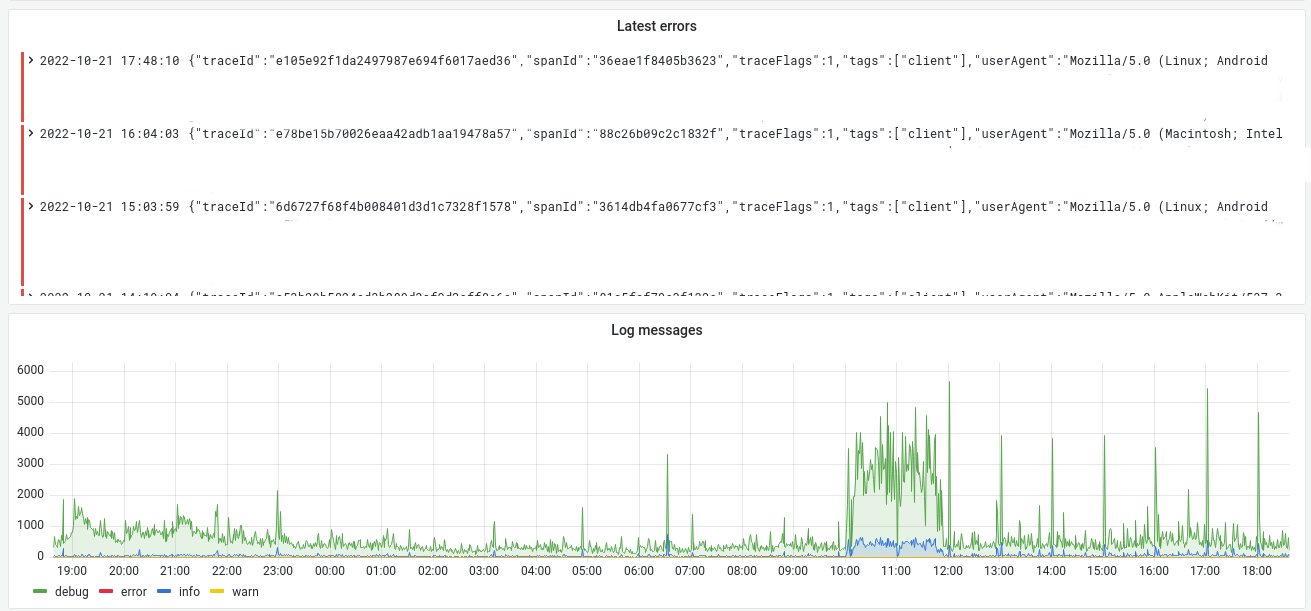
PeerTube is not able to send its logs to a third-party yet.
To send PeerTube logs to Loki, you will need the promtail software.
Install promtail locally by downloading the binary on your PeerTube server: https://grafana.com/docs/loki/latest/clients/promtail/installation/#binary
Use the following configuration as promtail.yaml:
server:
  http_listen_port: 3101

clients:
  -
    basic_auth: # If you use basic auth on your Loki instance using a reverse proxy for example
      username: loki
      password: your-password
    url: http://loki.example.com:3100/loki/api/v1/push

positions:
  filename: /tmp/positions.yaml

target_config:
   sync_period: 10s

scrape_configs:
  - job_name: peertube
    static_configs:
      - targets:
          - localhost
        labels:
          job: peertube
          instance: peertube.example.com
          __path__: /var/www/peertube/storage/logs/peertube*.log
    pipeline_stages:
      - json:
          expressions:
            timestamp: timestamp
            level: level
      - drop:
          source: "level"
          value: "audit"
      - labels:
          level:
      - timestamp:
          format: RFC3339
          source: timestamp
Now we need to automatically start promtail. We can use systemd for that purpose. Create /etc/systemd/system/peertube-promtail.service file with the following content (replace your-user and /path/to/promtail-directory):
[Unit]
Description=Send logs to Loki
After=peertube.service

[Service]
Type=simple
User=your-user
Group=your-user
StandardOutput=journal
ExecStart=/path/to/promtail-directory/promtail -config.file=/path/to/promtail-directory/promtail.yaml
Restart=always

[Install]
WantedBy=multi-user.target
Enable this service as root:
systemctl daemon-reload
systemctl enable peertube-promtail
systemctl start peertube-promtail
Your logs are now sent to your Loki instance.
PeerTube traces in Tempo
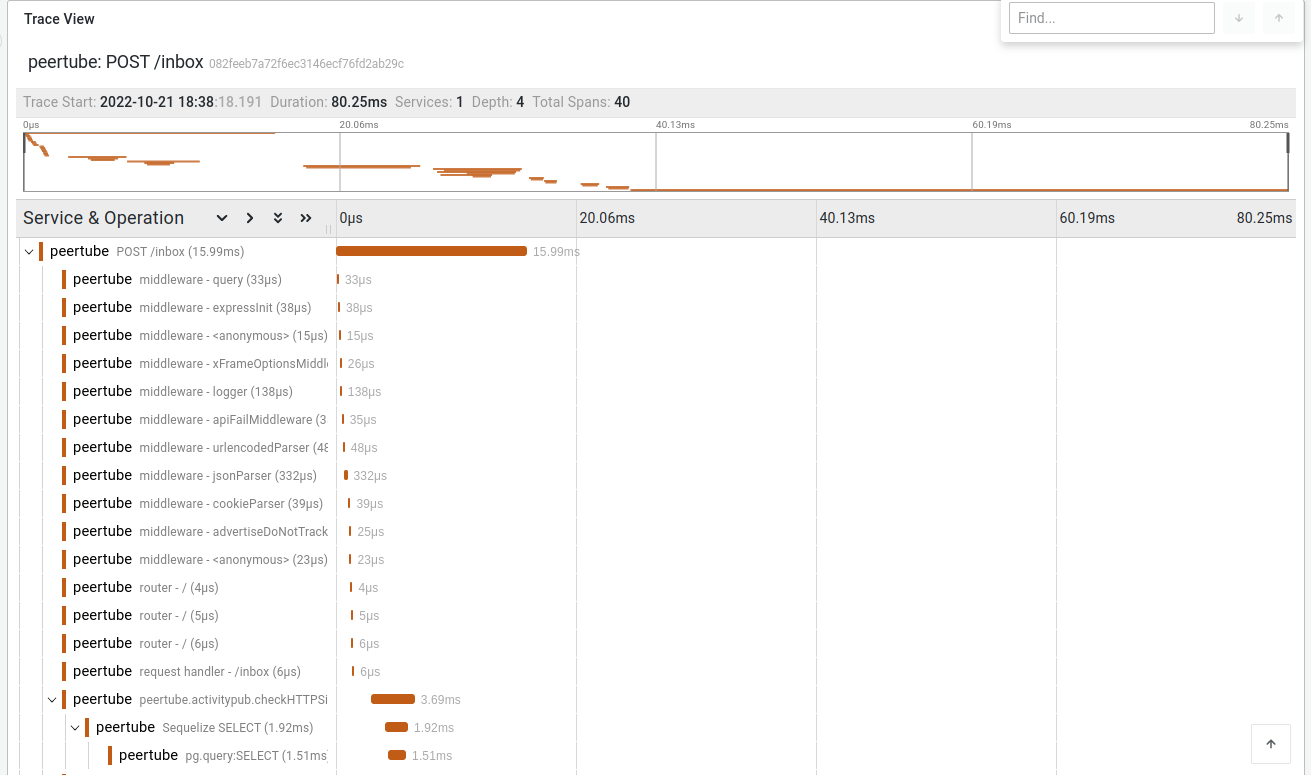
Traces are interesting to debug slow PeerTube platforms and to help developers to find slow paths in PeerTube code. They can be automatically sent by PeerTube to a Jaeger compatible endpoint (like Tempo in this guide).
Configure PeerTube to send traces
Update your PeerTube configuration and set open_telemetry.tracing.enabled to true and configure your Jaeger endpoint in open_telemetry.tracing.jaeger_exporter.endpoint (for example http://tempo.example.com:14268/api/traces).
After a PeerTube restart, your logs can now be queried on your Tempo instance.
Visualize data in Grafana
Grafana can be easily configured to display graphs, logs, information from Prometheus, Loki and Tempo. Since creating these dashboard could be long, you can import this dashboard in your Grafana instance: monitoring.json.